How do you know how effectively a brand is represented at an exhibition? Companies usually look at the number of meetings held, the quality of new contacts, and how those conversations develop into negotiations.
But these numbers only tell part of the story. To get a clearer picture of event marketing performance, it is also important to look at how people interact with the brand throughout the event; from their first encounter with the company to their conversations and engagement with the team.
At iGB L!VE 2026, N1 Partners, together with RexLab, took a data-driven approach to understanding this behavior. For the first time, they combined traditional event metrics with data on visitor engagement to get a more complete view of how audiences interacted with the brand.
Goals before the analytics
Prior to the exhibition, N1 Partners marketing team identified questions to track the event effectiveness:
- What potential reach does the brand achieve at the exhibition?
- How does the audience move from the first point of contact to visiting the booth?
- At which stage is the largest drop-off of potentially engaged visitors observed?
- Which elements of the event experience attract the most attention?
- What solutions can be used to optimize future events?
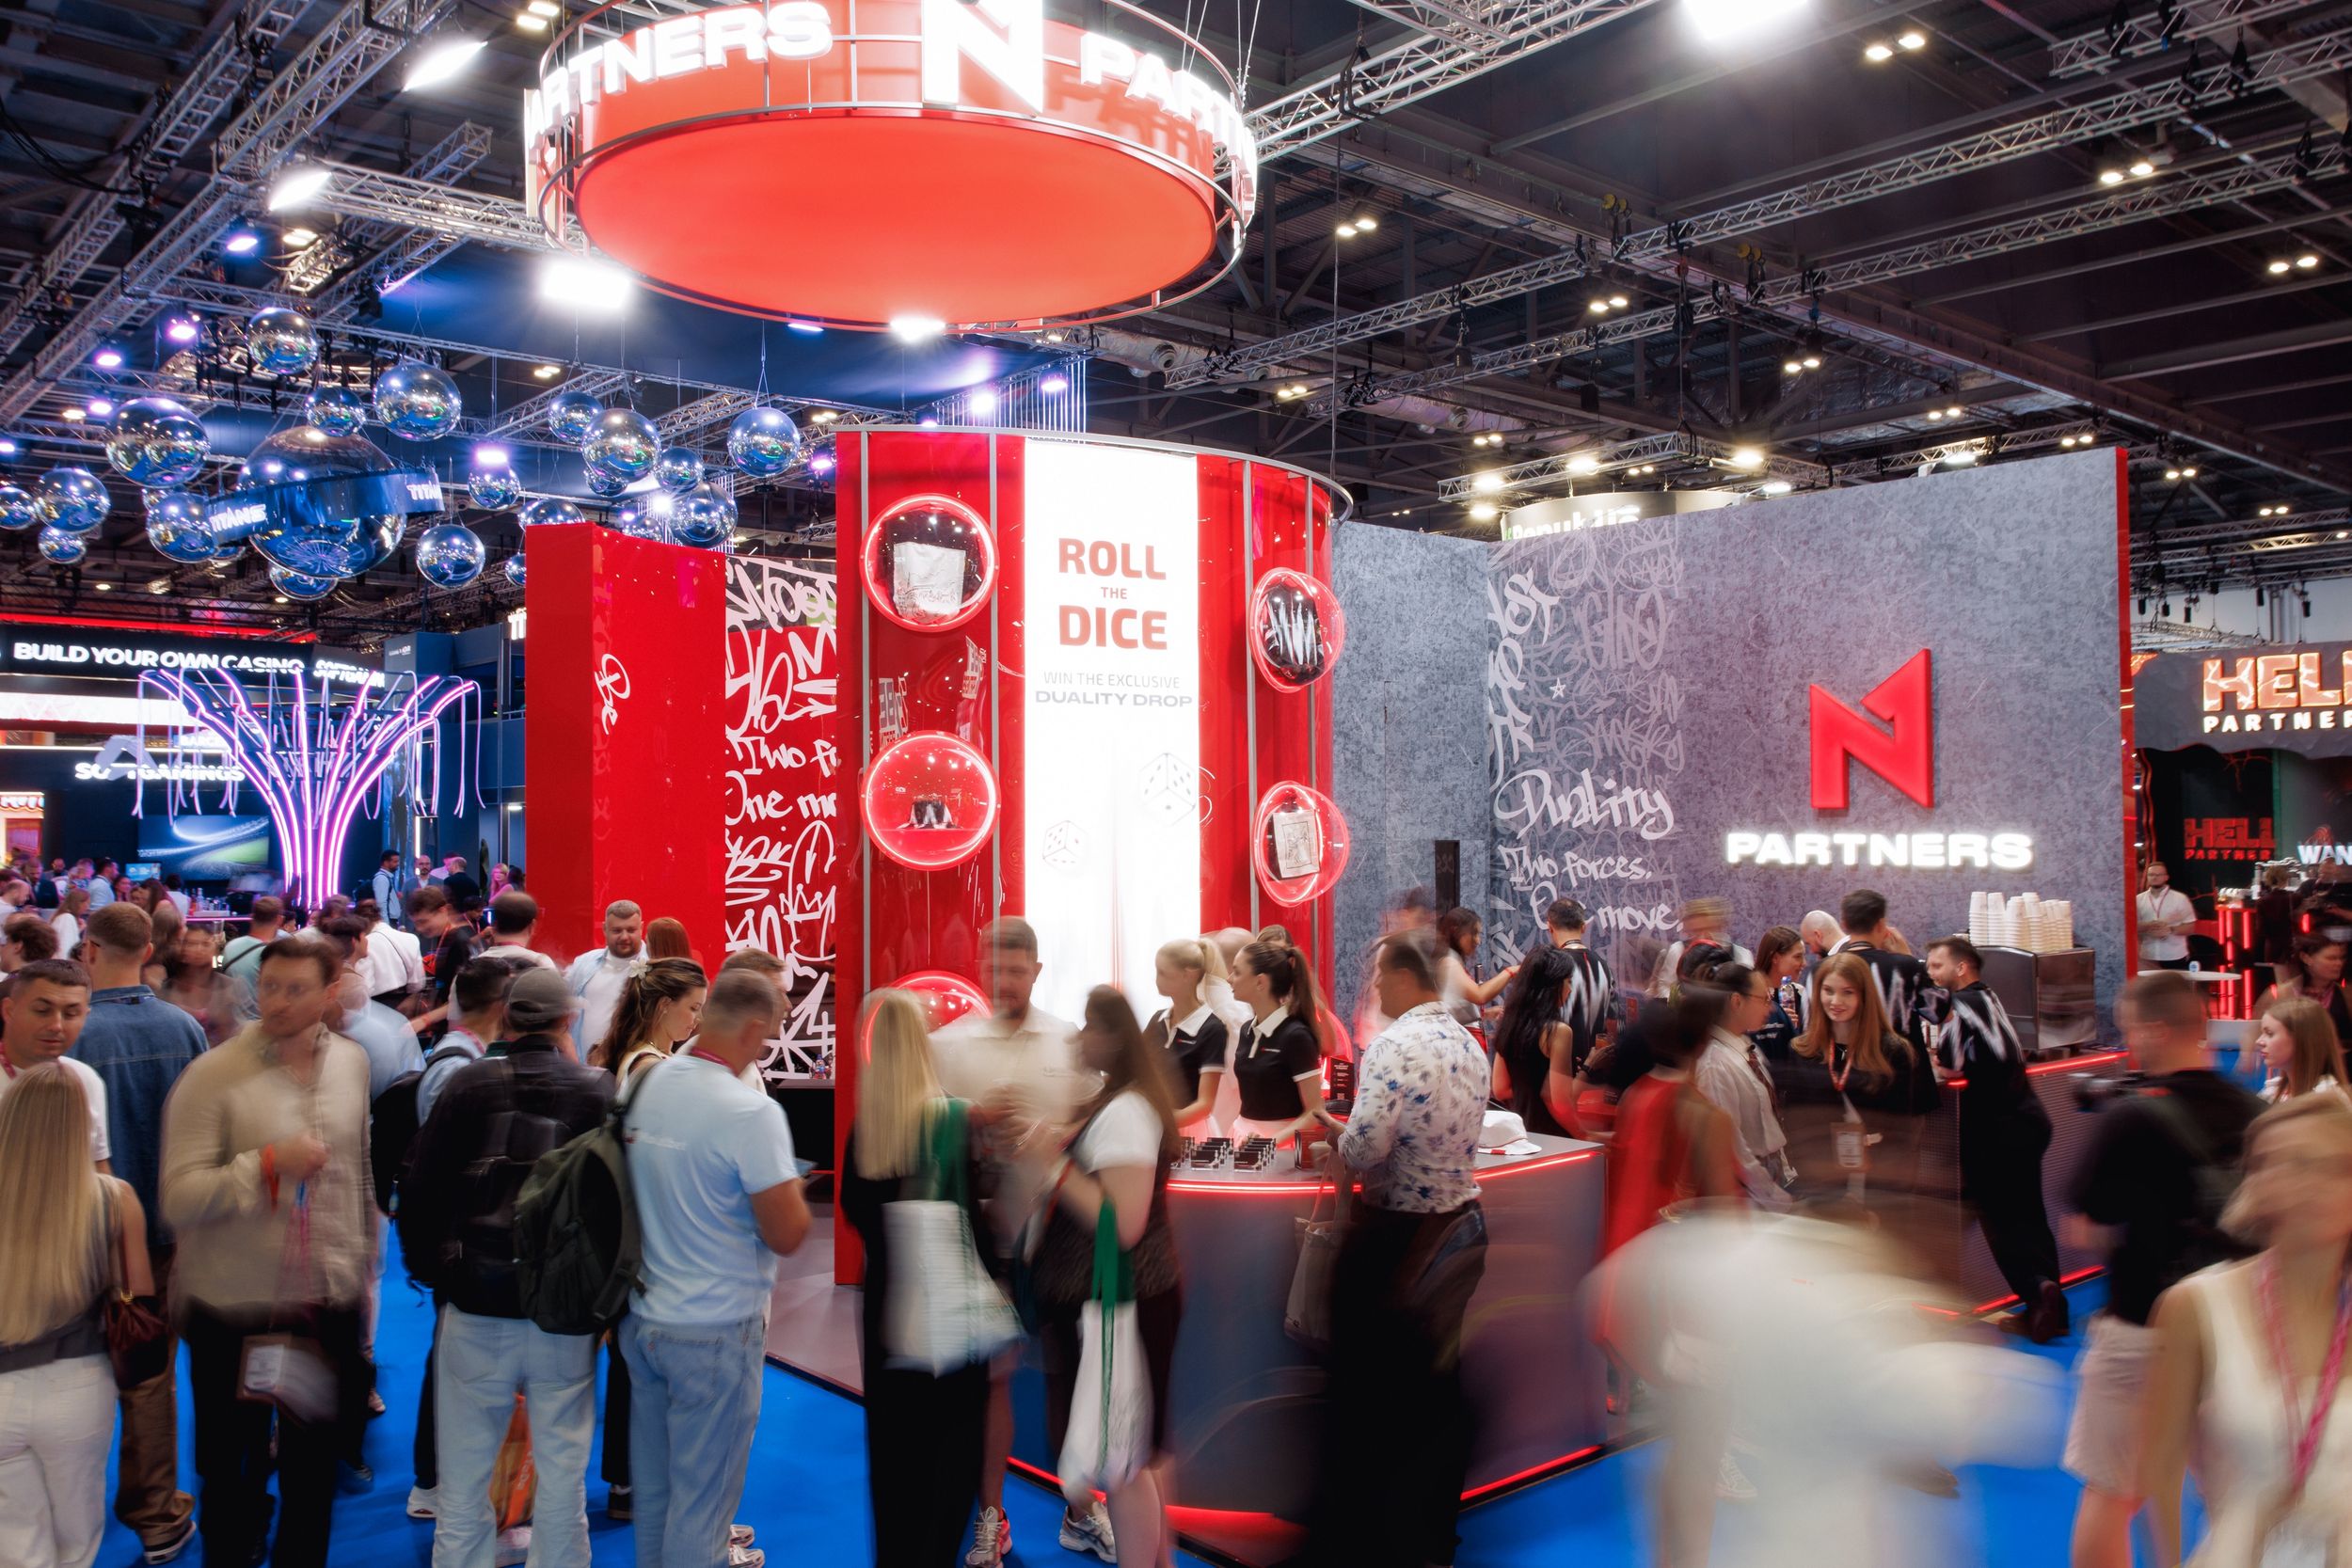
Previously, the team relied mainly on its own observations and experience to understand audience behavior. This offered a useful general picture, but there was no way to back up those findings with statistical data.
How the data was collected
A network of sensors was installed at the N1 Partners booth to anonymously detect the presence of mobile devices within the coverage area. The system assigned each device an anonymized ID, making it possible to eliminate duplicate counting.
After the exhibition, the team received data on audience movement patterns, dwell time within the space, and transitions between the different stages of the funnel.
The analysis was conducted in two stages: first, the team examined the engagement funnel; then, they analyzed how attention was distributed across the space.
Engagement funnel
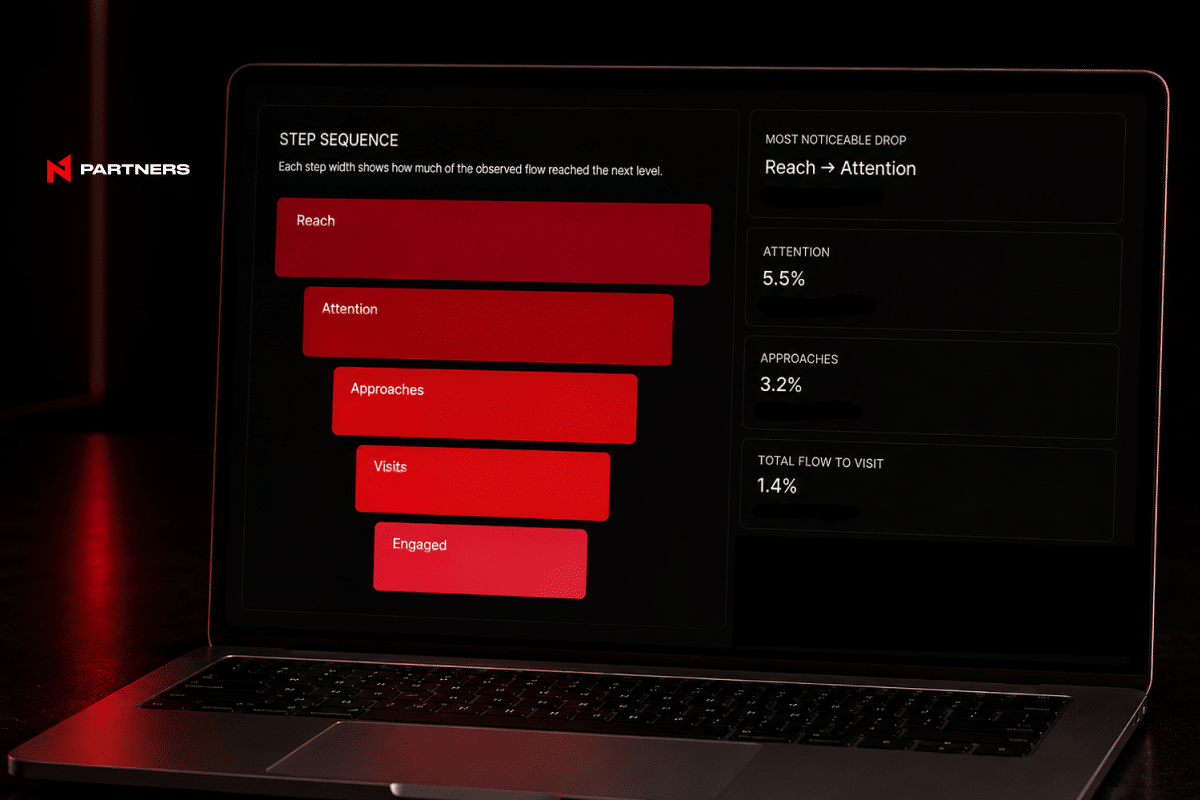
To evaluate the effectiveness of working with the audience at different stages of the event experience, the N1 Partners team developed a funnel from potential contact to active interaction.
N1 Partners team developed a funnel ranging from potential exposure to active interaction to evaluate the audience engagement effectiveness at different stages of the event experience:
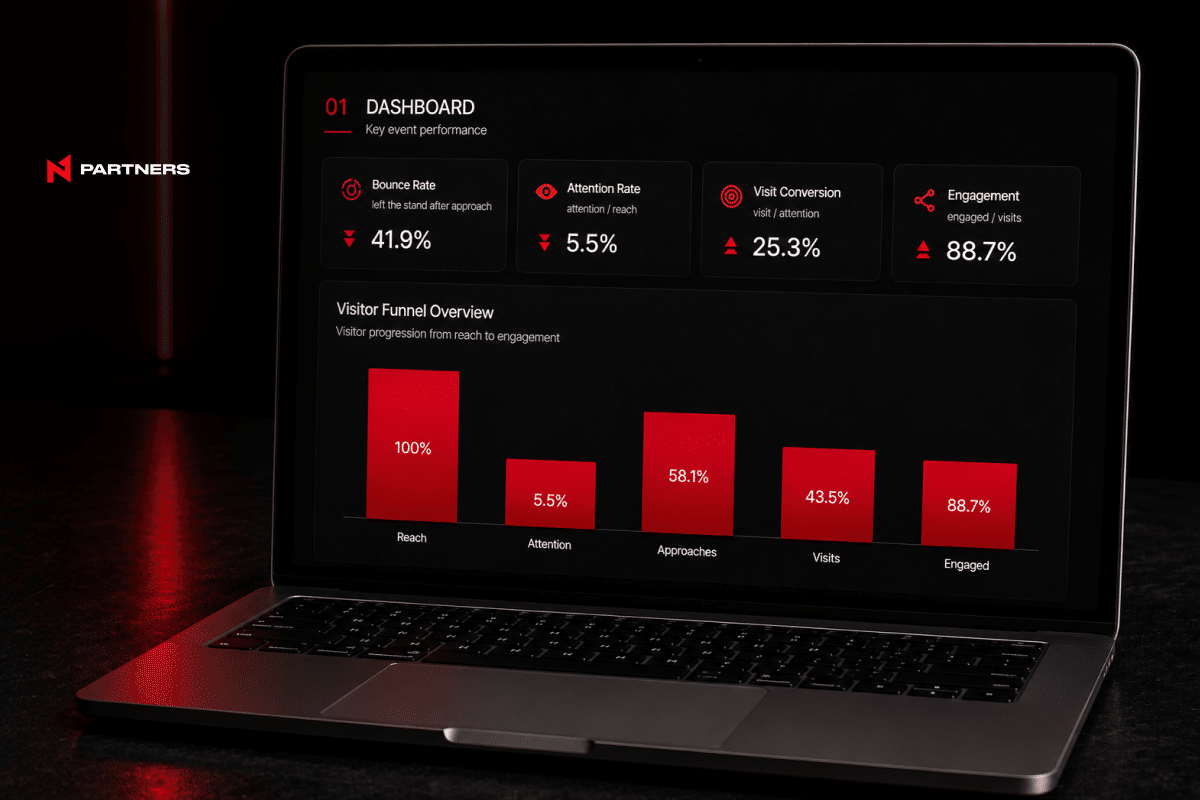
Reach → Attention → Approaches → Visits → Engagement
- Reach: the overall flow of exhibition attendees who were potentially exposed to the brand area.
- Attention: attendees who noticed the booth and its communications.
- Approaches: delegates who demonstrated additional interest and moved closer to the exhibition area.
- Visits: attendees who entered the N1 Partners space.
- Engagement: visitors who proceeded to actively interact with the booth and the team.
Of the total attendee flow, 5.5% noticed the booth, which represents around one thousand people.
More importantly, 88.7% of visitors who entered the space went on to actively engage with the brand. This suggests that the booth was effective at attracting the right audience. Although only a relatively small share of total attendees reached the engagement stage, those who did were highly interested in the brand.
This points to the biggest opportunity at the top of the funnel: getting more people to notice the booth and encouraging passing attendees to stop and visit. Once visitors entered the space, engagement was already strong.
Heat maps
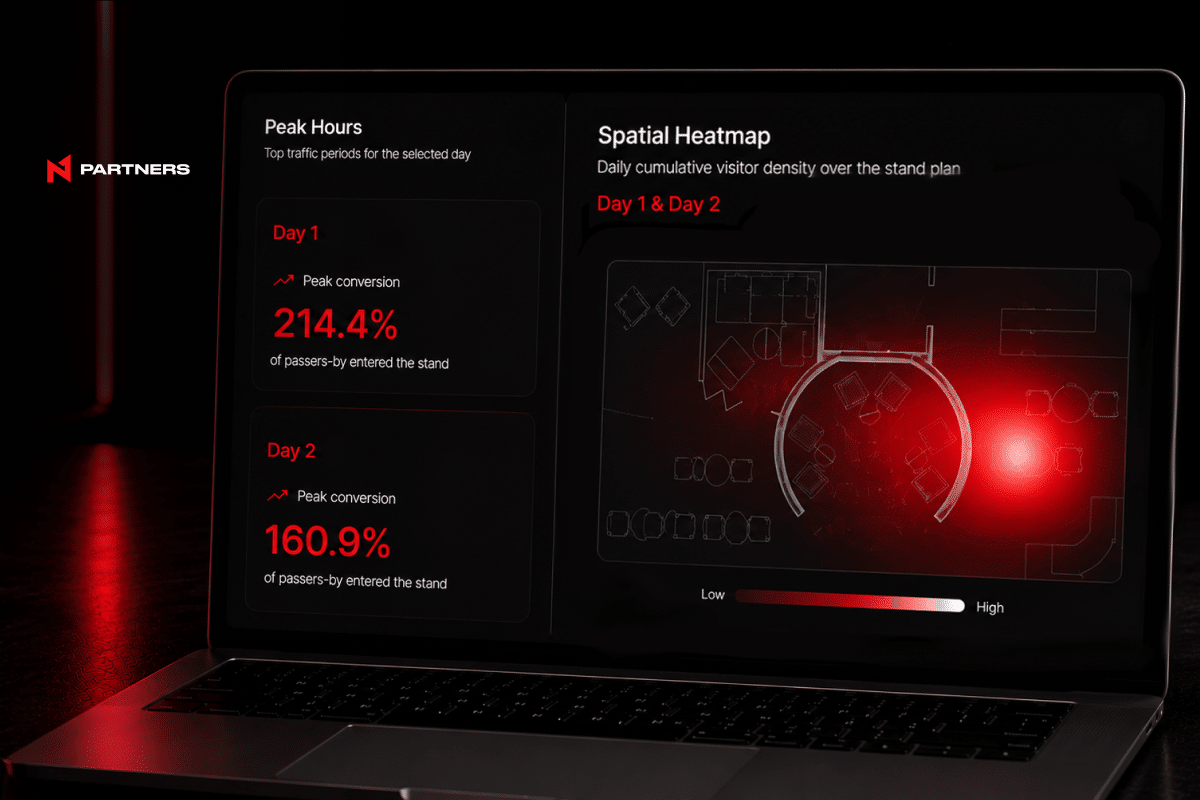
While the funnel shows how engagement changes from one stage to the next, heat maps provide a closer look at what attracts visitors and how they move around the booth.
The analysis showed that several areas drew more attention than others. These included the live art performance by British artist Clym Evernden, who has worked with brands such as Hermès, Prada, Tiffany, and Diptyque, as well as a display featuring a limited-edition capsule collection created in collaboration with him.
Other areas included collectible toys by designer and creator Yoomoota, whose work has been exhibited at PAD London, Art Miami, and the Red Dot Museum, along with an activity zone, meeting rooms, and a bar.
The traffic patterns suggest that visitors were more likely to stay and engage when there was something to see or take part in. Live performances, exclusive items, and interactive activities all gave attendees an additional reason to spend time at the booth.
The highest Peak Conversion was recorded between 13:00 and 14:00 on the first day, reaching 214.4%. According to RexLab, this figure represents the ratio of booth visitors to people who passed by the booth during a selected period, which means the rate can exceed 100%.
The results also show why timing matters when planning booth activities. Identifying periods of higher traffic can help teams decide when additional staff may be needed, when to schedule activities, and how to make better use of the space.
These insights can also inform future conference planning, from adjusting the layout of different zones to testing new ways of directing visitor traffic through the booth.
What the case study showed
The data collected and the subsequent analysis highlighted three key findings:
- High engagement among the target audience: conversion after entry: 88.7% of visitors who entered the space proceeded to actively interact with the team.
- The main growth potential lies at the upper stages of the funnel: increasing attention and driving more booth visits.
- The quality of interaction depends on zone placement, audience flow, and timing: the highest Peak Conversion was recorded on the first day, reaching 214.4% between 13:00 and 14:00.
Checklist: questions to ask after an exhibition
The iGB L!VE experience helped the team identify four questions to consider when evaluating future events.
After each event, it is useful to look beyond the final performance numbers and ask what the results mean for future participation:
- Which booth elements should be retained? Identify the zones, activities, and engagement formats that delivered the strongest results.
- What can be changed in the next project? Identify areas for improvement, from zone placement to visitor flow scenarios.
- Which hypotheses should be tested next? For example, changing the attendee journey, reallocating space, or introducing new touchpoints.
- What should be compared with previous events? Track how changes to the booth concept affect audience attention and engagement.
This approach makes it possible to carry insights from one exhibition into the planning of the next: retaining effective solutions, adjusting zone placement, and testing new approaches to organizing the space.
Insights: from analysis to action
The data makes it possible to look beyond the performance of a single event and use the findings to improve event marketing over time.
- Space: Optimize zone placement and test different ways of directing visitor flow.
- Engagement: Test different touchpoints and interaction formats before the event.
- Timing: Schedule activities around periods of higher visitor traffic.
- Benchmarking: Compare results across event, track how performance changes over time.
- Testing: Try new approaches and measure how they affect visitor engagement.
Taken together, these findings show how event marketing can become an ongoing process of testing, learning, and improvement. Each event provides new data that can be used to refine the next setup, understand audience behavior, and make better decisions about future participation.
For N1 Partners, this data-driven approach is part of a broader focus on building strong and lasting relationships within its partner ecosystem. Through the N1 Partners program, affiliates can work with more than 14 casino and betting brands across 10+ Tier-1 GEOs, with CPA rates reaching €700 and RevShare of up to 55% + NNCO available to top partners.
The team also works with partners on a wider range of marketing activities, including content projects, media placements, PR, SMM, and other marketing collaborations. Depending on the project, N1 Partners can explore different cooperation formats and opportunities for ongoing partnership.
Team contacts: